
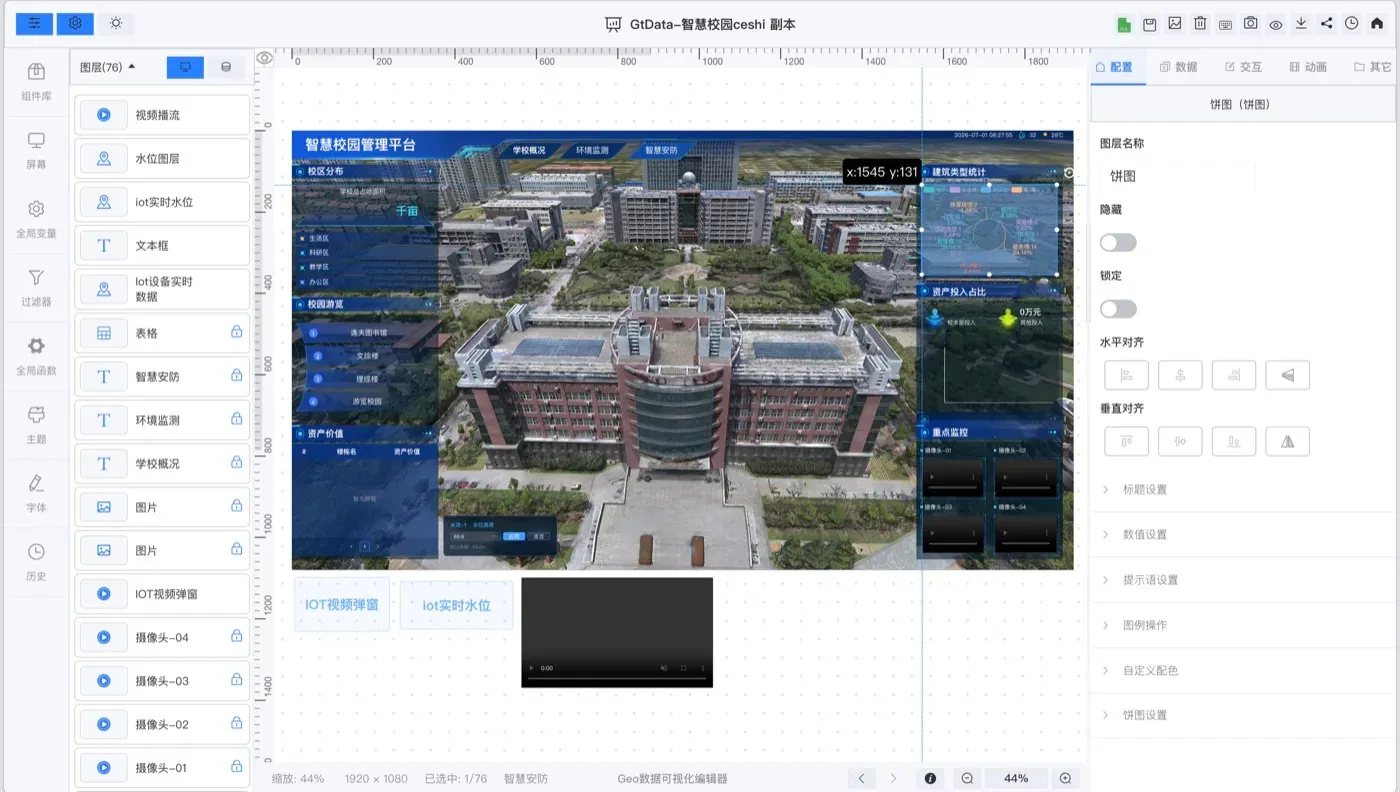
Drag-and-drop editing
Flexible layout, multi-device adaptation and WYSIWYG editing.
A modular, configurable dashboard builder for spatial data and business metrics.
OVERVIEW
GeoTwin BI is a modular, configurable visualization tool for multi-source spatial data. It turns complex data into clear visuals and lets teams assemble a business dashboard quickly.
It is used for smart city operations, infrastructure planning and enterprise analytics.
CAPABILITIES
Flexible layout, multi-device adaptation and WYSIWYG editing.
Links twin objects with charts and indicators in the same view.
Maps, charts, indicators and device components.
Connects Excel data, service data and IoT data.
Start your digital twin
We can arrange a demo around your data and deployment conditions.